Engineering benchmarks for cap-and-trade
Beer, poultry, sugar and dehydrated flavors might sound more like ingredients in July Fourth party foods than industries covered by California’s new cap-and-trade law.
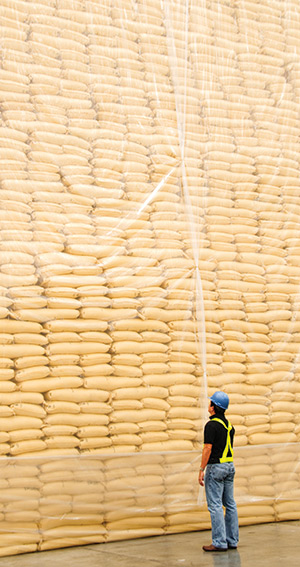
Industrial-sized sugar processing plants fall under the scrutiny of new cap-and-trade regulations.
But in this agricultural powerhouse of a state, a handful of industrial-sized facilities making or processing food products in those four sectors each generate 25 metric tons or more annually of carbon dioxide (CO2), the primary greenhouse gas emitted through human activities.
Berkeley engineers, led by Margot Hutchins, are helping the California Air Resources Board, which administers cap-and-trade regulations, to develop methodologies for determining CO2 allocations for such companies as MillerCoors, Foster Poultry Farms, Spreckels Sugar and Sentient Dehydrated Flavors.
“We are the first ones to do product-based benchmarks for food,” says Hutchins, a post-doc researcher in the Mechanical Engineering Laboratory for Manufacturing and Sustainability. “The Europeans didn’t do it, which is part of what’s so novel about what we’re doing.”
In 2006, the California State Legislature approved AB 32, which creates economic incentives for large CO2 emitters to reduce greenhouse gases. The goal is for the state’s overall CO2 emissions to shrink to 1990 levels by 2020.
Large CO2 emitters that go over their board-granted allocation, or “cap,” must make up the difference by bidding for unused allocations from other companies. This gradual squeeze encourages companies to reduce their greenhouse gas emissions, because to emit more, they must pay for the privilege.
Benchmarks for CO2 emission reduction come in two flavors:
Energy-based benchmarks apply an emissions factor to the amount of fuel a facility has used in the past, converting that into an annual allowable CO2 emissions starting point. The board will then decide how much less CO2 must be produced each year until 2020.
But Hutchins says product-based benchmarks are more practical for food and beverage manufacturers who want to continue to grow their business. She and her team are researching how much energy, on average, it takes to produce, say, a barrel of beer, or a pound of processed chicken, sugar or dehydrated flavors such as onion, garlic, chili peppers and parsley.
That figure then becomes part of the product-based benchmark “recipe” for creating each sector’s allocations.
